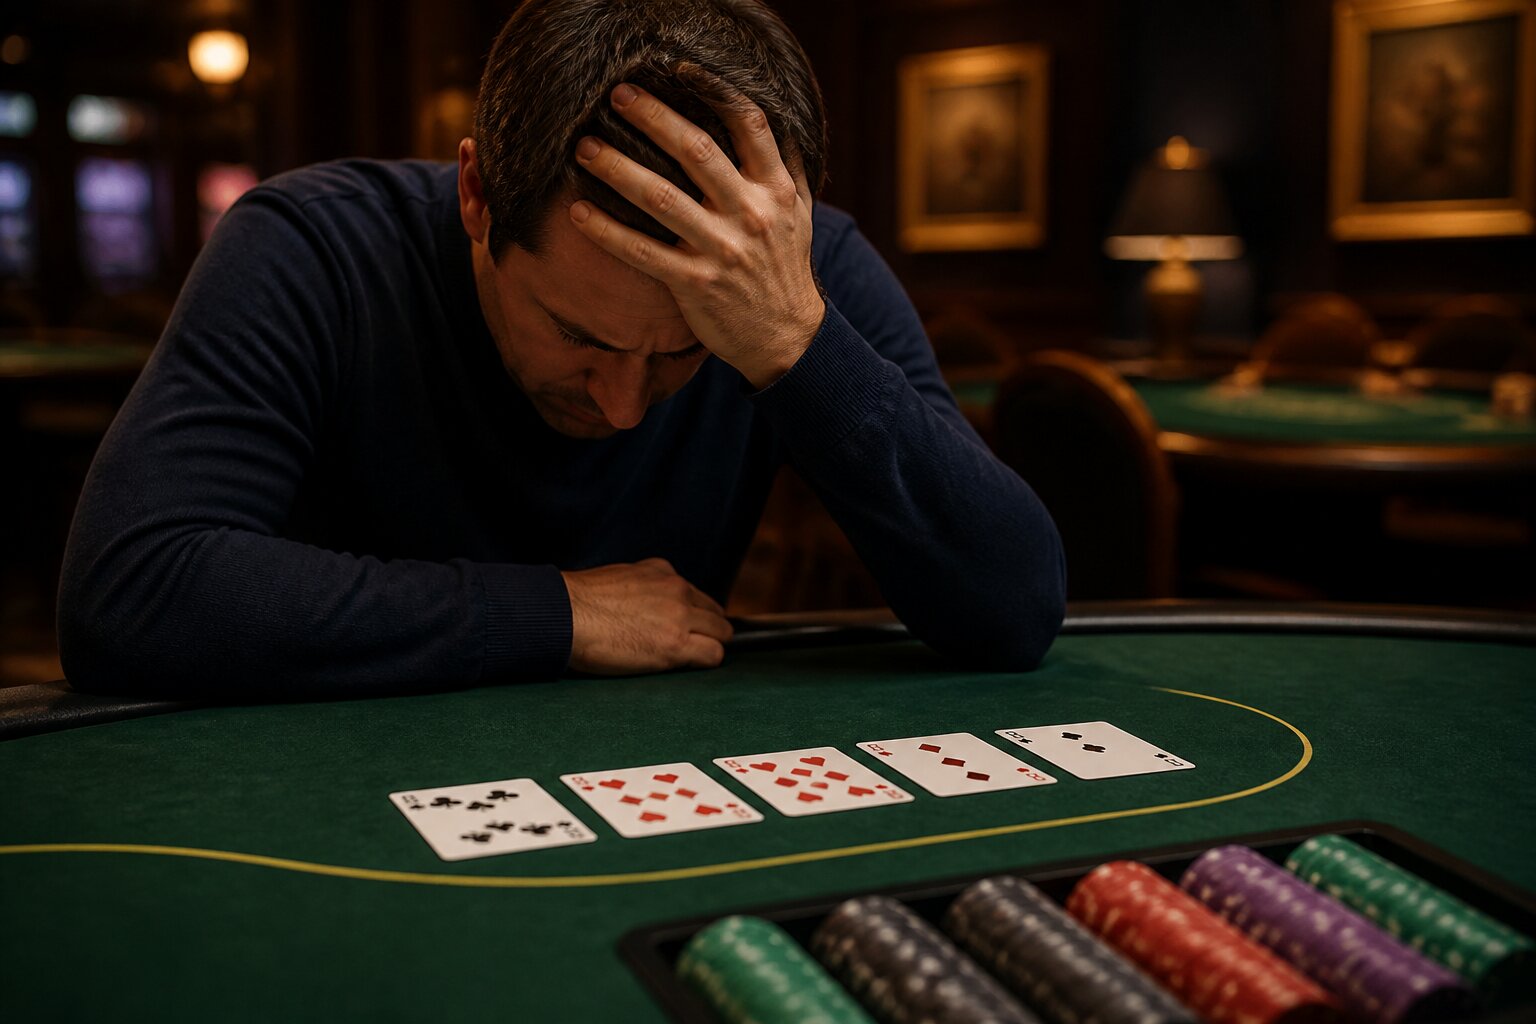
Ever wondered just how likely it is to hit a losing streak at the blackjack table? Whether you play occasionally or study the game, a run of losses can feel bewildering and unsettling.
This article breaks down the maths behind consecutive losses, explains the factors that shift those probabilities, and compares blackjack streaks with other casino games so you can see how common these runs really are.
How Do Blackjack Odds Work?
Blackjack offers some of the most player-friendly odds in a casino, largely because decisions made by the player affect the outcome. Even so, the house maintains a long-term advantage. Each hand is a separate event, and outcomes are governed by statistical probabilities and player choices rather than any external force.
In a typical multi-deck game with standard rules, a player using basic strategy will win roughly 42–49% of hands, push about 8–9% of the time, and lose the remainder. That spread depends on exact rules and the number of decks. When players apply optimal basic strategy—mathematically derived choices for hit, stand, split and double—the house edge usually sits between about 0.5% and 2%. Deviating from basic strategy or taking side bets raises that edge.
Common payout ratios are:
- 3:2 for a natural blackjack
- 1:1 for a regular win
Dealer wins occur according to the table rules, with pushes returning stakes on tied hands.
Understanding these baseline figures prepares us to calculate the chance of several losses in a row and to explore how rule changes or different deck counts alter those odds.
What Is the Probability of Losing Consecutive Blackjack Hands?
To calculate the chance of losing X hands consecutively, start with the probability of losing a single hand. For a standard game with basic strategy, a reasonable working figure for a single-hand loss is about 48%. The probability of losing X hands in a row is that single-hand loss probability raised to the power of X, written mathematically as 0.48^X.
Some examples:
- Four losses in a row: 0.48^4 ≈ 0.0531, or about 5.3%.
- Five losses in a row: 0.48^5 ≈ 0.0255, or about 2.6%.
- Ten losses in a row: 0.48^10 ≈ 0.0011, or about 0.11%.
These probabilities show that longer losing runs become rapidly less likely on a single sequence, although they remain possible over many hands. Next we'll look at the specific variables that cause the single-hand loss probability to vary from table to table.
Variables That Affect Your Chances
A number of practical factors change the odds of losing individual hands, and therefore alter the probability of consecutive losses. These include the number of decks in use, the precise house rules and payout structure, and the quality of player decisions. Understanding these influences helps to explain why calculated streak probabilities are only as accurate as the inputs used.
Number of Decks in Play
The number of decks significantly affects card distributions and the frequency of naturals. Single-deck games tend to give a slight advantage to the player compared with six-deck games. As an illustration, the house edge can be around 0.17% for single-deck tables but rise to roughly 0.46% with six decks under similar rules. That shift modifies the single-hand loss probability, and by extension any multi-hand loss calculation.
Deck penetration and the way cards are shuffled also matter. If fewer cards are dealt before a shuffle, the changing composition of the shoe has less effect on subsequent hands. In contrast, deeper penetration can make card composition slightly more relevant to short-term streaks, although for most casual players the impact remains modest.
House Rules and Payouts
Small variations in rules have measurable consequences. For example, paying 6:5 for a blackjack rather than 3:2 increases the house edge by more than one percentage point. Rules on whether the dealer hits or stands on soft 17, and limits on doubling and splitting, also change the expected returns. These rule differences translate directly into higher or lower chances of losing each hand.
Ties, surrender options and whether late surrender is allowed also affect the expected loss or gain per hand. Even side bets and optional rules that appear separate from the main game can change the overall volatility a player faces. When calculating streak probabilities it is important to use the specific rule set in play rather than relying on broad averages.
Player Choices Versus Pure Chance
Blackjack is distinctive because player decisions influence outcomes. Following mathematically derived basic strategy reduces the house edge; errors increase it. No decision path removes the house advantage entirely. While strategy affects the single-hand loss probability used in the power calculation above, it does not alter the fact that each hand is an independent event.
Player behaviour also affects variance. Aggressive deviations from basic strategy, unconventional bet sizing and inconsistent play increase short-term swings and can lead to longer apparent streaks of wins or losses. Conversely, disciplined play and consistent stakes produce outcomes that more closely match the probabilistic expectations used in streak calculations. With these points in mind, the numerical examples given earlier should be treated as illustrative rather than definitive for every real-world session.
With those variables in mind, the next section compares how streak probabilities in blackjack measure against other common casino games.
Comparing Blackjack Streaks to Other Casino Games
Streak calculations rely on a single-event loss probability for each game. For roulette on a European wheel, a straight even-money bet like red or black wins about 48.65% of the time, so the chance of losing four such bets in a row is roughly 0.5135^4 ≈ 7%. That is a touch higher than the four-loss example for blackjack given earlier.
Baccarat’s banker and player bets have their own win-loss splits; betting on the banker is commonly cited as having a slightly lower player win rate, producing a different consecutive-loss profile. Using the earlier blackjack example (48% loss per hand), losing four hands in a row comes to about 5.3%, while the comparable figures for roulette and baccarat vary according to their single-bet probabilities.
These comparisons underline that every game comes with its own streak risk. The calculation method remains the same: identify the single-event loss probability, then raise it to the power of the number of consecutive hands. Next we turn to whether sequences of losses reveal any genuine pattern worth acting on.
Can Losing Streaks Indicate a Pattern?
Patterns can seem obvious when watching outcomes unfold, but statistically there is no carryover from one hand to the next. Each deal is independent, so a string of losses does not make a subsequent win more or less likely. Perception of patterns is common—humans look for order in random sequences—but that perception does not change the underlying mathematics.
Common misconceptions include believing a win is “due” after several losses or that changing bet sizes will force a different result. In reality, betting systems cannot alter the house edge or break a streak. Recognising this helps avoid decisions driven by the appearance of patterns rather than by clear probability.
With the statistical independence of hands established, the final section looks at why understanding these odds matters for how players approach the game.
Why Understanding Odds Matters for Players
Grasping the odds helps set realistic expectations and supports better money management. Knowing that losing sequences are a normal statistical possibility makes it easier to design a bankroll that absorbs runs of losses without escalating stakes in an attempt to recover. That mindset preserves funds and reduces stress in play.
Practical approaches that reflect an understanding of the maths include setting a firm spending limit, avoiding play when emotionally unsettled, and learning basic strategy to keep the house edge as low as possible. If play stops being enjoyable or causes harm, support services are available and it is important to use them.
By appreciating how probabilities shape outcomes, players can make measured decisions and treat blackjack as a structured game with known risks rather than as something to be “fixed” by chasing outcomes. This closes the discussion with a clear picture of how streaks arise and what they mean for anyone at the table.
Enjoy Casino Games at Online Bingo
At Online Bingo, we offer a friendly place to enjoy a wide variety of casino games, giving you the freedom to explore plenty of options and find what you like best. Our welcoming site is here to provide plenty of choice and entertainment at your own pace.
**The information provided in this blog is intended for educational purposes and should not be construed as betting advice or a guarantee of success. Always gamble responsibly.